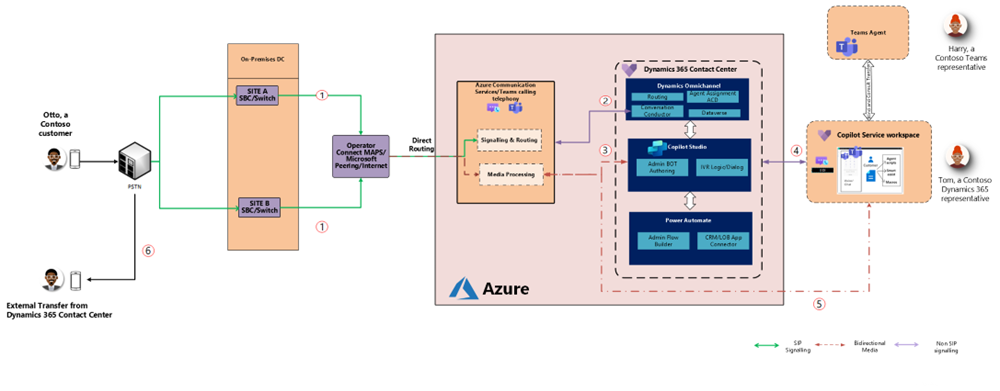
In Dynamics 365 Contact Center, a single conversation traverses multiple services: telephony infrastructure (SIP/SBC), Azure Communication Services (ACS), Teams Telephony, Copilot Studio, Unified Routing, and the agent workspace. Each component emits its own signals; but without a unified telemetry layer, correlating these signals into a coherent conversation flow is difficult.
Azure Application Insights provides that correlation layer.
Architecture Context: Where Telemetry Comes From
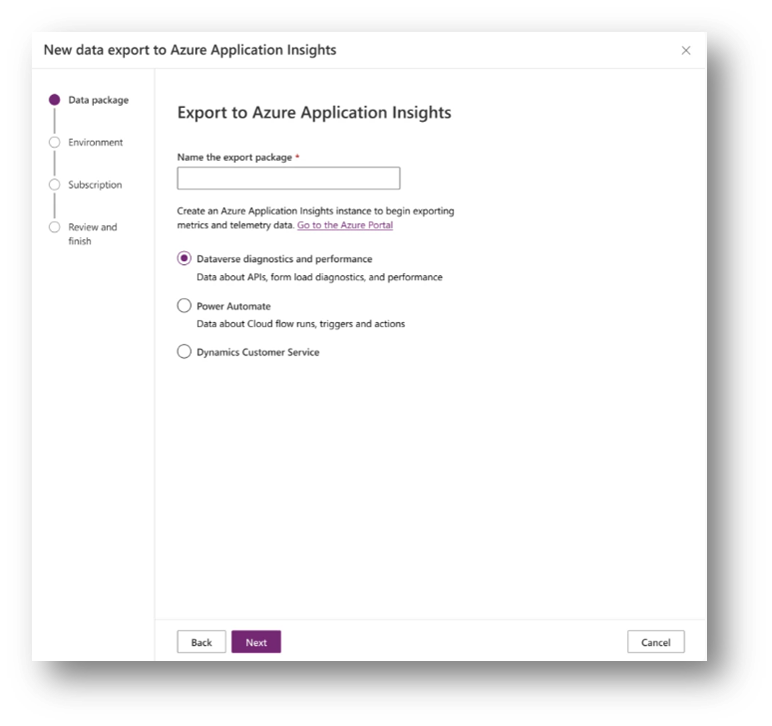
When Application Insights is connected via Power Platform Admin Center, Dynamics 365 Contact Center exports conversation lifecycle telemetry into Azure Monitor.
This telemetry primarily lands in the traces table, where each row represents a discrete event in the lifecycle of a conversation.
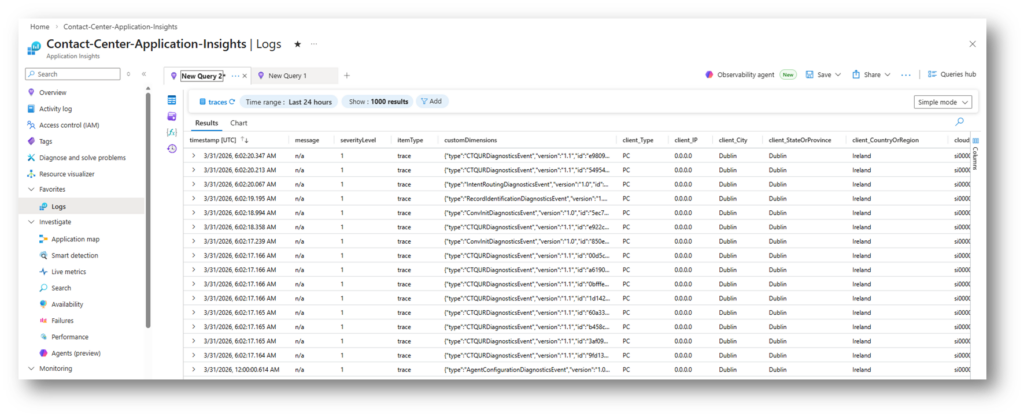
Key characteristics:
- Event-based model (not session-based)
- Multiple events per conversation (high frequency, near real-time)
- Correlation via conversationId / operationId
- Mixed event types depending on channel (voice vs messaging)
This creates a distributed trace of the conversation across the platform.
Typical conversation generates a sequence of events such as:
ConversationCreatedCustomerIdentifiedIntentEvaluatedRouteToQueueQueueAssignedAgentAssignedConversationClosed
Each event includes metadata such as:
- Timestamps
- Routing context
- Channel type
- Outcome (success/failure)
- Latency indicators
Rather than representing a conversation as a single object, the system emits granular lifecycle steps, which must be reconstructed through querying.
Diagnosing Conversation Failures in Dynamics 365 Contact Center Using Azure Application Insights
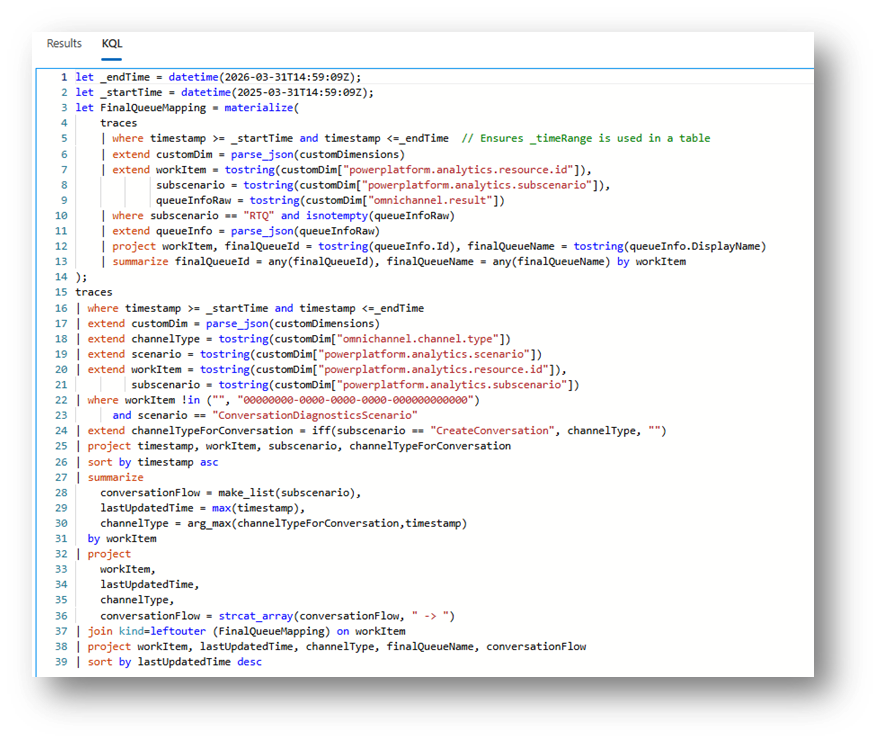
Reconstructing the Conversation Journey with KQL
To analyze a conversation, you typically:
- Filter by conversationId
- Order events by timestamp
- Inspect transitions and missing steps
Example (simplified):
traces
| where customDimensions.conversationId == "YOUR_CONVERSATION_ID"
| project timestamp, name, customDimensions
| order by timestamp asc
This allows you to reconstruct the full execution path.
What to Look For
A healthy flow includes, e.g. ConversationCreated → IntentEvaluated → RouteToQueue → AgentAssigned → Closed
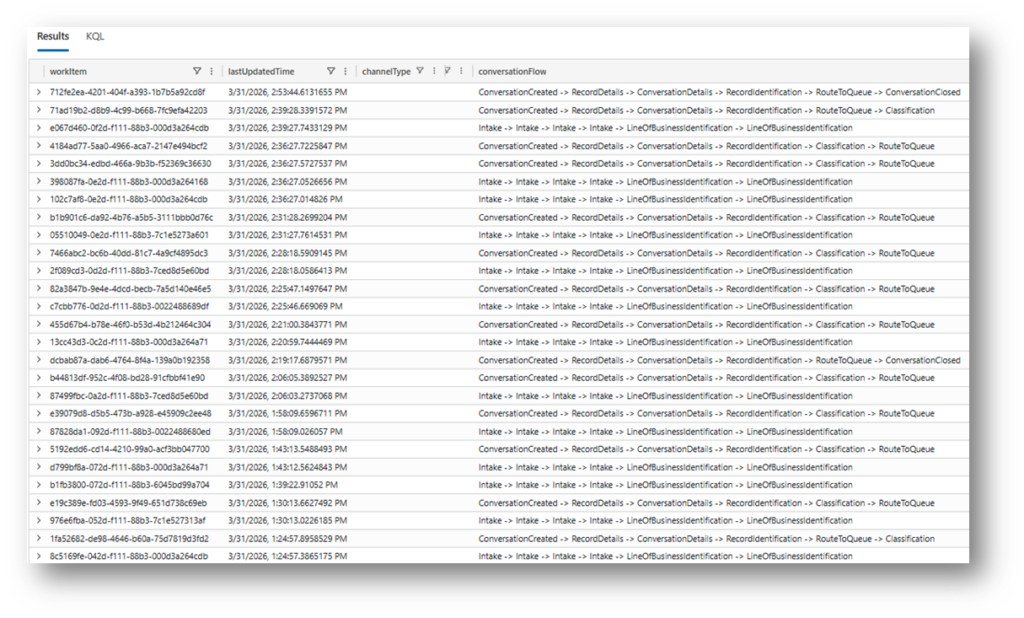
Common failure patterns:
- Missing
RouteToQueue→ failure before routing (often bot or intake issue) - Routing present, no assignment → capacity/skill mismatch
- Repeated events → retry loops or instability
- Early termination → disconnect or upstream failure
Diagnosing Real-World Issues
1. “Agent is available but receives no work”
From a telemetry perspective, this is rarely random.
You can validate:
- Whether the agent was included in routing evaluation
- Skill matching results
- Capacity constraints
- Assignment failures
If no AgentAssigned event exists, the issue lies in routing; not in the agent client.
2. “Calls are dropping”
Trace the sequence:
- Did the conversation reach routing?
- Are there repeated disconnect events?
- Does the flow terminate before queue assignment?
This often reveals:
- Telephony instability (ACS / Teams layer)
- Session interruptions
- Bot loop or timeout conditions
3. Conversations Stuck in Intake
A critical but often overlooked pattern:
If conversations never reach RouteToQueue, the issue is not routing logic.
Instead, it’s typically:
- Copilot Studio orchestration
- Context gathering failure
- External dependency timeout
This distinction is essential for correct root cause analysis.
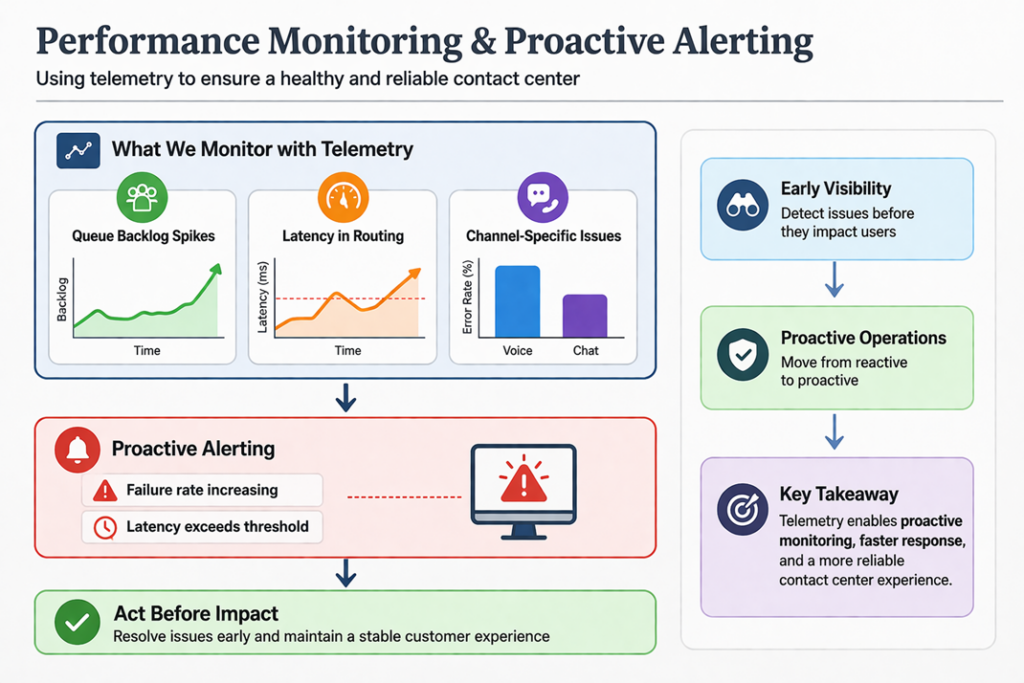
Moving from Reactive to Proactive Monitoring
Because telemetry is structured and queryable, it enables proactive monitoring scenarios.
Key Signals to Monitor
- Failure rate per event type
- Latency between lifecycle steps
- Queue backlog trends
- Channel-specific anomalies (voice vs chat)
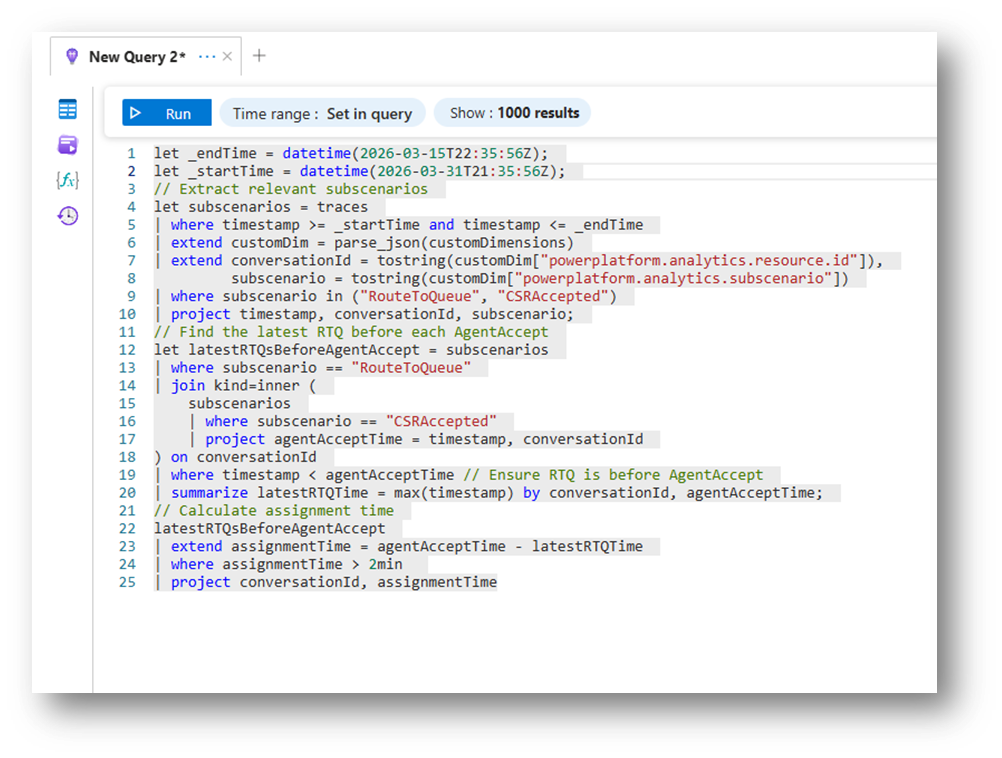
Example: Detect routing delays
traces
| where name == "RouteToQueue"
| extend latency = todouble(customDimensions.durationMs)
| summarize avg(latency), max(latency) by bin(timestamp, 5m)
Alerting Scenarios
- Spike in failed routing events
- Increased time between
ConversationCreatedandAgentAssigned - Abnormal disconnect frequency
This allows operations teams to act before users report issues.
Data Modeling Considerations
Volume & Cost
Application Insights is billed on ingestion:
- High conversation volume = high telemetry volume
- Voice channels generate more granular events
Retention Strategy
- Default retention may not be sufficient for long-term analysis
- Consider exporting to Log Analytics / Data Explorer for extended scenarios
One Connection Limitation
- Only one Application Insights resource per environment
- Requires planning for multi-team usage and access control
From Raw Telemetry to Operational Insight
Raw telemetry is not directly consumable by most users.
To operationalize it:
- Structure queries using KQL
- Build Workbooks for visualization
- Create dashboards for different personas:
- IT (deep diagnostics)
- Operations (queue health, failures)
- Business (volumes, trends)
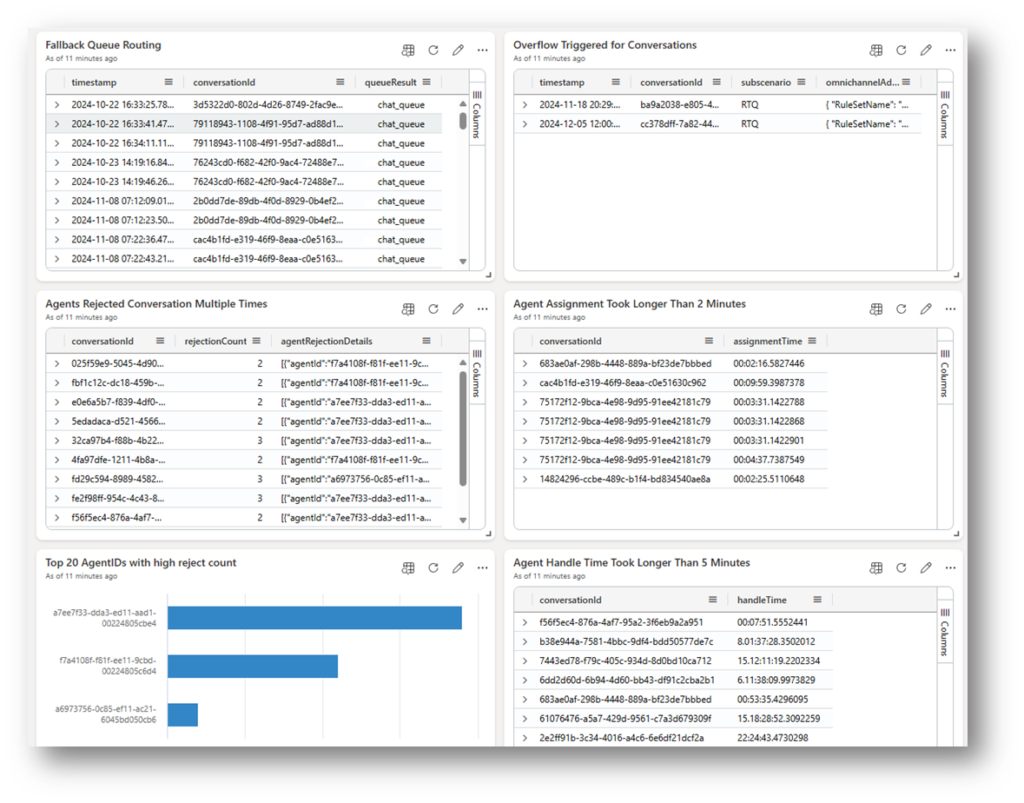
Microsoft FastTrack provides starter dashboard templates, which can accelerate this process microsoft/Dynamics-365-FastTrack-Implementation-Assets: Dynamics 365 FastTrack Implementation guides
Key Takeaways
- Dynamics 365 Contact Center emits event-based conversation telemetry, not pre-aggregated insights
- Application Insights enables end-to-end traceability across distributed services
- Effective use requires KQL-based reconstruction of conversation flows
- Most “random” issues are deterministic when viewed through telemetry
- The real value lies in combining:
- Tracing (what happened)
- Metrics (how often)
- Visualization (who needs to know)
Final Thought
Telemetry in Contact Center is not just logging—it is observability of the entire customer interaction pipeline.
Once you start treating conversations as traceable execution flows rather than isolated events, troubleshooting becomes engineering—not guesswork.
If you’d prefer to walk through these concepts in a more visual and guided format, I presented this topic as part of the Dynamics 365 Community Call on April 1st. The session covers the same foundations; along with live examples and explanations of how to interpret telemetry in real scenarios.
🎥 The recording is available on YouTube, so feel free to check it out if you want to see how this works step by step in practice. Kristine Risberg | Azure Application Insights in Contact Center | April 206 CRM Community Call
Lämna ett svar