
Exploring Telemetry Insights in the D365 Implementation Portal
The D365 Implementation Portal has introduced a new feature Telemetry Insights, which promises to give a closer look at how Dynamics 365 applications are performing in real time. The feature went into public preview in 2024, and since then, I’ve enabled it for a couple of environments utilizing the contact center solution in D365 Customer Service. After tracking a few recent refresh iterations and diving into the data, I have some thoughts and questions I thought I’d share in this post.
I did also share my feedback with the Product Group and was happy to be invited to a meeting with the Principal Program Manager of Dynamics 365 CXP Engineering, and a couple of other from her team, to share feedback and get further insights into the intended usage and feature pipeline.
Telemetry Insights, as described, provides a set of analytical and monitoring tools designed to track the performance, usage, and health of D365 applications. This is aimed at administrators and project stakeholders, offering a way to diagnose issues early in the implementation process, and even in live environments.
But what’s the reality of using this feature, especially in complex environments like D365 Contact Center, which includes voice and chat? Let’s take a closer look.
Setting Up Telemetry Insights: A Few Questions
The setup process is straightforward enough. If your tenant ID is tied to an existing Dynamics 365 project, you can associate the telemetry request with that project via a dropdown. Alternatively, if you’re working with a production environment, you don’t need a project at all – you can enable telemetry insights just by entering the tenant and environment ID. That’s convenient, right?
However, there’s one small catch: If you’re working with a tenant different from the one you’re logged into, you’ll need customer consent for data sharing. It’s a minor but important step to remember, similar to what you’d do when logging a new implementation project.
Performance Rules: What Are They Really Telling Us?
Let’s talk about the rules. There isn’t a way in which you can select the rules or performance functions you want to track. Instead, you are presented with a ruleset based on the output threshold values . Fair enough, it might not be a disadvantage to track performance across the full ruleset.
Checking the Microsoft Learn page on Telemetry insights overview (preview) we can see that the ruleset includes the following:
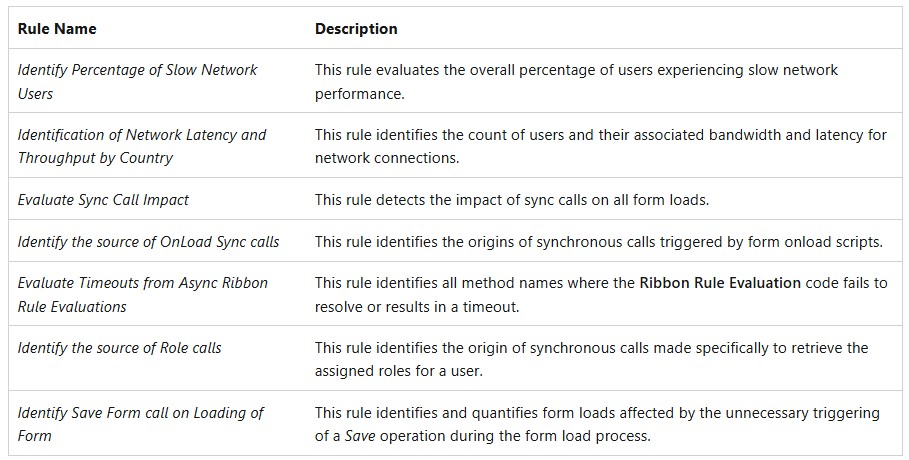
This list is in no way complete as the full set expands over 70 different rules. A full inventory is planned to be released publicly when the feature hits GA.
Do we have enough clarity on why these rules matter? And how are they actually helping us improve system performance? Not really, at first glance. We need to look at each rule to better understand its content and purpose.
The list of rules where threshold values or key metrics have been exceeded or conditions in other ways met, are presented with a drill-down option into every date, where there was a result output, for the last seven consecutive runs.
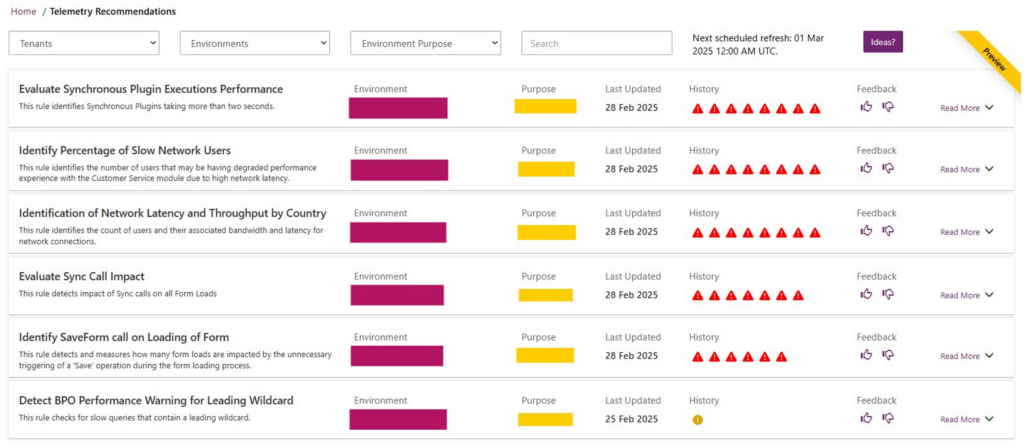
Let’s dive into some of the performance rules in more detail.
Evaluate Synchronous Plugin Executions Performance
This rule checks if any synchronous plugins are taking more than two seconds, which can noticeably slow down the system. But what does it actually mean to “evaluate” this performance? Does two seconds really represent the tipping point for performance degradation, or are there other factors we need to consider?
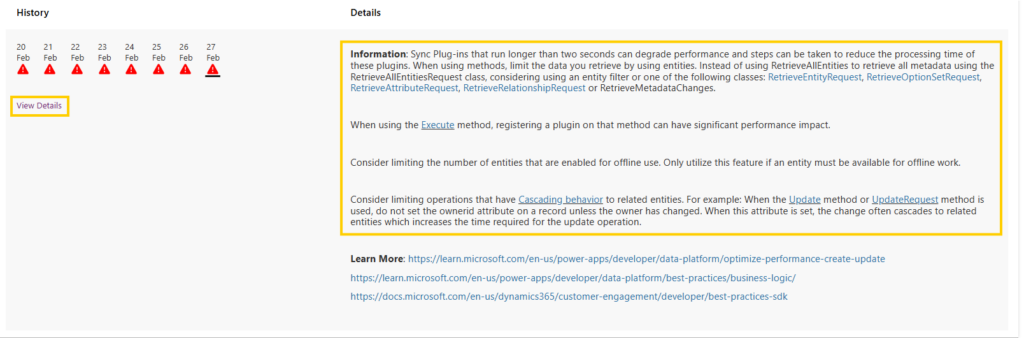
The system shows us the 90th percentile execution time, which represents a point where 90% of the plugins are executed faster than the specified time but where the execution time is relatively slow for the top 10% of plugin executions. So in this example, if the ExecutionTime_P90inSecond is reported as 5,09 seconds, it means that 90% of synchronous plugin executions took less than 5,09 seconds, while 10% of them took longer than 5,09 seconds.
By tracking the 90th percentile of execution time, we can do a performance benchmarking and assess the overall performance of the system’s synchronous plugins to evaluate if there are any specific plugins that stand out and needs optimization.
In general, there is no fixed ”normal” range, as each deployment can differ based in use case, environment, and customizations. Most synchronous plugins should ideally execute in less than 2 seconds as this would generally not impact user experience. Execution times in the +5 second range are touching on limit where performance might degrade, and should be evaluated for further optimization.
Percentage of Slow Network Users
Another interesting rule identifies users who might be experiencing performance issues due to high network latency. High network latency could adversely affect the overall experience and page load times. By drilling into the details we can further investigate network bottlenecks and possible causes. The metrics show me the percentile of users that have been affected by slow network (SlowUserCount) based on the total numbers of users active (TotalUsersCount) on that particular date.
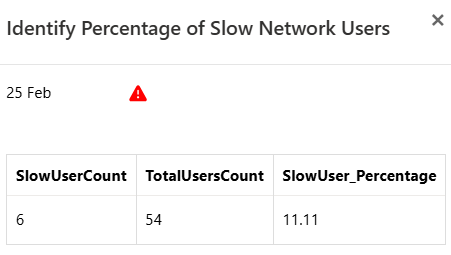
But here’s the kicker; while we can see the percentage of affected users, we can’t pinpoint exactly who those users are. This featured does not display any PII and to identify the affected users, we’d need to look to query for, or monitor, this information in Azure Application Insights.
Network Latency by Country: What’s Really Happening Behind the Numbers?
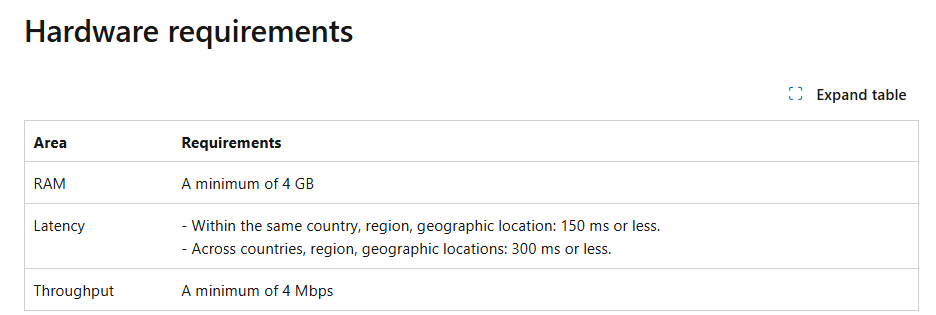
What happens when you’re monitoring a global organization? The Network Latency and Throughput by Country rule could give you valuable insights into country-specific network performance. The data includes metrics for network bandwidth and latency at the 50th and 95th percentiles.
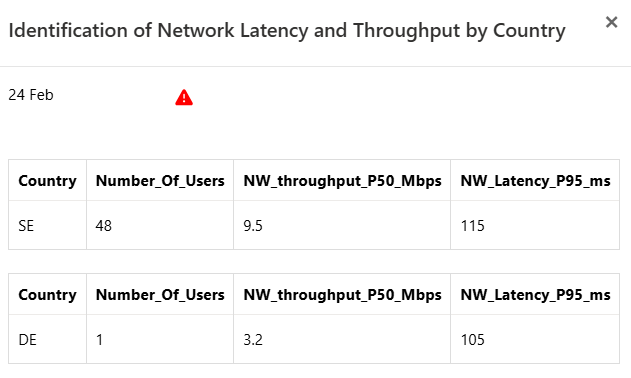
The 50th percentile is the median value of throughput for a given time period, i.e. where 50% of network throughput measurements are below the specified value, and 50% are above it. Megabits per second is the unit of measurement for throughput, indicating the amount of data that is being transferred over the network every second. Higher values indicate that data is flowing faster, while lower values indicate slower throughput.
So if, NW_Throughput_P50_Mbps has a value of 9.5, this would mean that the median network throughput for the users/devices is 9.5 Megabits per second and that half of the users are experiencing throughput higher than 9.5 Mbps, whereas the other half are experiencing throughput lower than 9.5 Mbps.
With Microsoft official recommendations being a throughput of min
4 Mbps a median value of 9.5 would presumably be acceptable, but not definitely so since we don’t know the throughput values of the lower half of users/devices. If we look at the single user in Germany, however, the throughput median value subsceeds the recommended 4 Mbps.
The issue here is that the 50th percentile gives you a decent median view, but it does not give us a full picture of network performance across all users? And what about those who fall in the lower half of the spectrum?
The 95th percentile latency metric NW_Latency_P95_ms shows us the 95% of network latency measurements which are below the specified value, and the 5% that are above it. Essentially, this metric focuses on the higher-end latency and gives you a sense of how bad the worst network conditions are, as experienced by most users. It’s often used to identify performance bottlenecks or intermittent slowness in the network.
Evaluate Sync Call Impact
This rules refers to issues related to synchronous network calls in Dynamics 365 (D365), and how they can negatively impact performance, especially when it comes to page load times. Synchronous network calls are calls that block the execution of any other operations (like JavaScript code or additional network requests) until they have completed. This can lead to delays, as the system has to wait for the current network call to finish before proceeding with the next one. The blocking can be problematic because it increases the load times of forms and grids (e.g., the UI will be slower to load), and can result in a poor user experience.
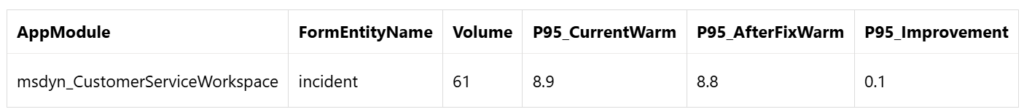
Looking at the details for a singular date, we can see that 61 operations were made on the incident (case) form. The P95_CurrentWarm value shows us the 95 percentile of response time (in seconds) for the top 5% of the slowest operations under the current conditions. (I had to ask ChatGPT about the ’warm’ reference and was informed that ’warm conditions’ likely refer to an environment where the data or system is ”warmed up” and not under the initial load (i.e., not the first interaction, but when the system is ready and active). A wait time of 8.9 seconds in 5% of the operations, would mean that 3 operations during the course of this date had a response time of almost 9 seconds.
Some general recommendations to optimize, or avoid, synchronous networks calls are to either reducing the number of synchronous network calls which will result in faster page load times, or move certain calls to asynchronous methods. Asynchronous calls don’t block other processes thus allowing tasks to run simultaneously, improving the overall experience.
To identify which synchronous calls are running in your D365 environment and potentially causing negative performance impact, you can use your browser’s Developer Tools to inspect network requests and identify synchronous calls that may be affecting performance. Filter the network requests to e.g. XHR (XMLHttpRequest) or Fetch to see API calls. Check whether metadata calls like RetrieveAllEntities or RetrieveEntity are run and are taking too long.
The P95_AfterFixWarm value displays the load time after fix was performed. A 0.1-second improvement in a large number of slow operations could help reduce overall load time and enhance user experience, especially if the top 5% of operations represent a significant number of interactions. But since the number of operations was so small, and given that the percentual improvement was so small, this did most likely not have any impact on user experience.
I’ve checked the details on other dates and the improvement range only between 0.1-0.2 seconds, which might seem like no improvement at all. t might be difficult to understand what type of change the P95_AfterFixWarm value measures against, if you know of no active fixes to form scripts, changes to ribbon rules or customizations to plugins or workflows during the measured time period.
This confused me a lot.🤔 But it turned out to make complete sense.
Because, the specific details of where the “fix” applies can be found across the related rules (Identify the Source of Ribbon Rule Sync Calls and Identify the Source of On Load Sync Calls). The P95_AfterFixWarm value is the anticipated target value should a fix be implemented. The documentation will be enhanced to further clarify this.
I will use logs from Azure Application Insights to track any specific errors and better understand potential performance bottlenecks, or network calls that were improved between the two measurement periods. Application Insights can be used to track dependencies, including external HTTP requests or web API calls, which can give insights into network performance. I’ll dive deeper into Application Insights in an upcoming post.
While the data is useful, there’s a lingering question: how do we interpret the data when we see a 0.1-second improvement in response time? Is that enough to make a tangible difference in the user experience? And how can we be certain that this data reflects real changes made in the environment?
Identify SaveForm call on Loading of Form
This rule detects and measures the number of ’Save Form’ operations that occur when an ’Edit Form’ is loaded. A Save Form operation means that a form (such as an incident record) is being saved, potentially due to automatic actions (e.g. a plugin) or user interactions (e.g. triggering a workflow) that trigger a save operation as soon as the form is loaded.
In the details I can see that this operation occurs on both standard, and custom, tables, in both standard and custom model driven apps. If we, again, look at the incident table in the Customer Service Workspace app, the TotalVolume shows the total number of operations involving the form (including Save and non-Save operations) for the incident table. It’s shown as 0, meaning no other operations (such as saving the form manually or submitting it in another way) were counted separately. This could suggest that the 21 Save operations might be causing all of the activity on the form.
Volume_Percentage should indicate what percentage of the total operations the Save Form operations represent out of the total operations for the incident. In this case, since TotalVolume = 0 the metric is likely calculating incorrectly or not at all.
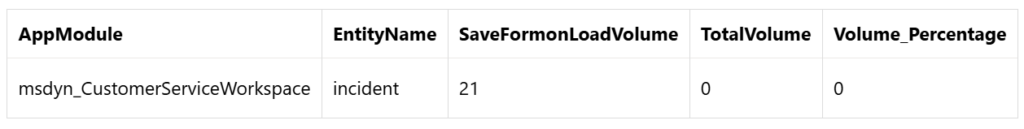
What the telemetry is in summary showing us is that there were 21 Save operations triggered when the form was loaded for incidents. This is likely excessive and can have a negative impact on performance, as every time the form is loaded, it tries to save automatically, which can result in delays, increased load times, and unnecessary network calls. Frequent Save Form operations can significantly degrade the user experience by increasing page load times and consuming unnecessary resources.
In this scenario I would give myself an action point to investigate if this organization has workflows, plugins, or custom JavaScript that are saving the form as soon as it loads, and evaluate if we can change the behavior to ensure the save operation happens only when the form data is actually updated or when the user finishes editing.
Detect BPO performance warning for leading wildcard
At first glance, I didn’t really understand what this refers to as I’d never heard the expression before. A quick search told me that a wildcard is the symbol with which you query for values that match a pattern, rather than an exact string, as you often do in Quick Find queries with *, e.g. *report, or %report, as would be used in SQL based queries. When querying using a leading wildcard (that appears at the beginning of a search term) the database has to perform a full table scan to find matching records. A general recommendation is to use trailing wildcards instead. When the wildcard is at the end of the string, the query can still efficiently use indexes to find matching records, without needing a full scan.
This rule did only output a warning message on one date during a measurement of six days, which might not indicate an immediate, critical issue, but it does highlight a potential area for performance improvement.
Key Takeaways
- Dashboard Design: The telemetry insights dashboard is well-organized and easy to navigate. It’s designed intuitively enough that, as a partner, I can use it to identify areas of concern for my customers and point out where deeper investigations might be needed.
- Rules & Thresholds: While the dashboard is easy to use, the threshold definitions could use some clarification, especially for newcomers to the feature. Adding explanatory popups or links to rule descriptions would make it much easier to understand what’s being measured and why it matters. Measured values and expected values but be clearly distinguished.
- Potential for Further Customization: The inability to specify which performance rules to track feels like a missed opportunity. Especially if wanting to synchronize tracking across multiple tools when doing troubleshooting. Being able to select specific rules to monitor based on a customer’s unique setup could make the tool more useful and targeted.
Final Thoughts as the Public Preview draws to an end
Telemetry Insights brings a lot of value to the table in terms of monitoring performance, although there are still areas where this feature could be improved. The data is compelling, but its full potential is unlocked only when we dig deeper into the context behind the numbers. And let’s not forget—usability enhancements, like clearer rule descriptions and more control over what data is shown, could really make this a game-changing feature for Dynamics 365 users. Would a bit more transparency and flexibility make this feature even more powerful? Only time will tell one it hits GA in a few weeks time.
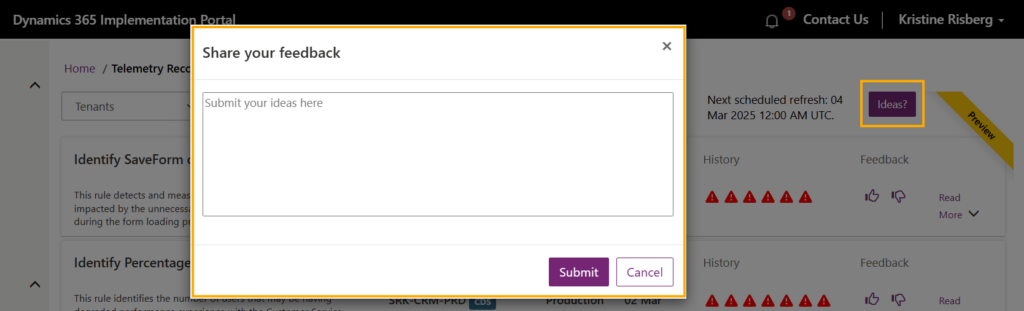
Feedback can be sent to through the Ideas? button on the Telemetry page or to the D365 CXP Engineering Support/Product Team at FTD365IP-Support@microsoft.com
Lämna ett svar